Link for Online Interactive Demo.
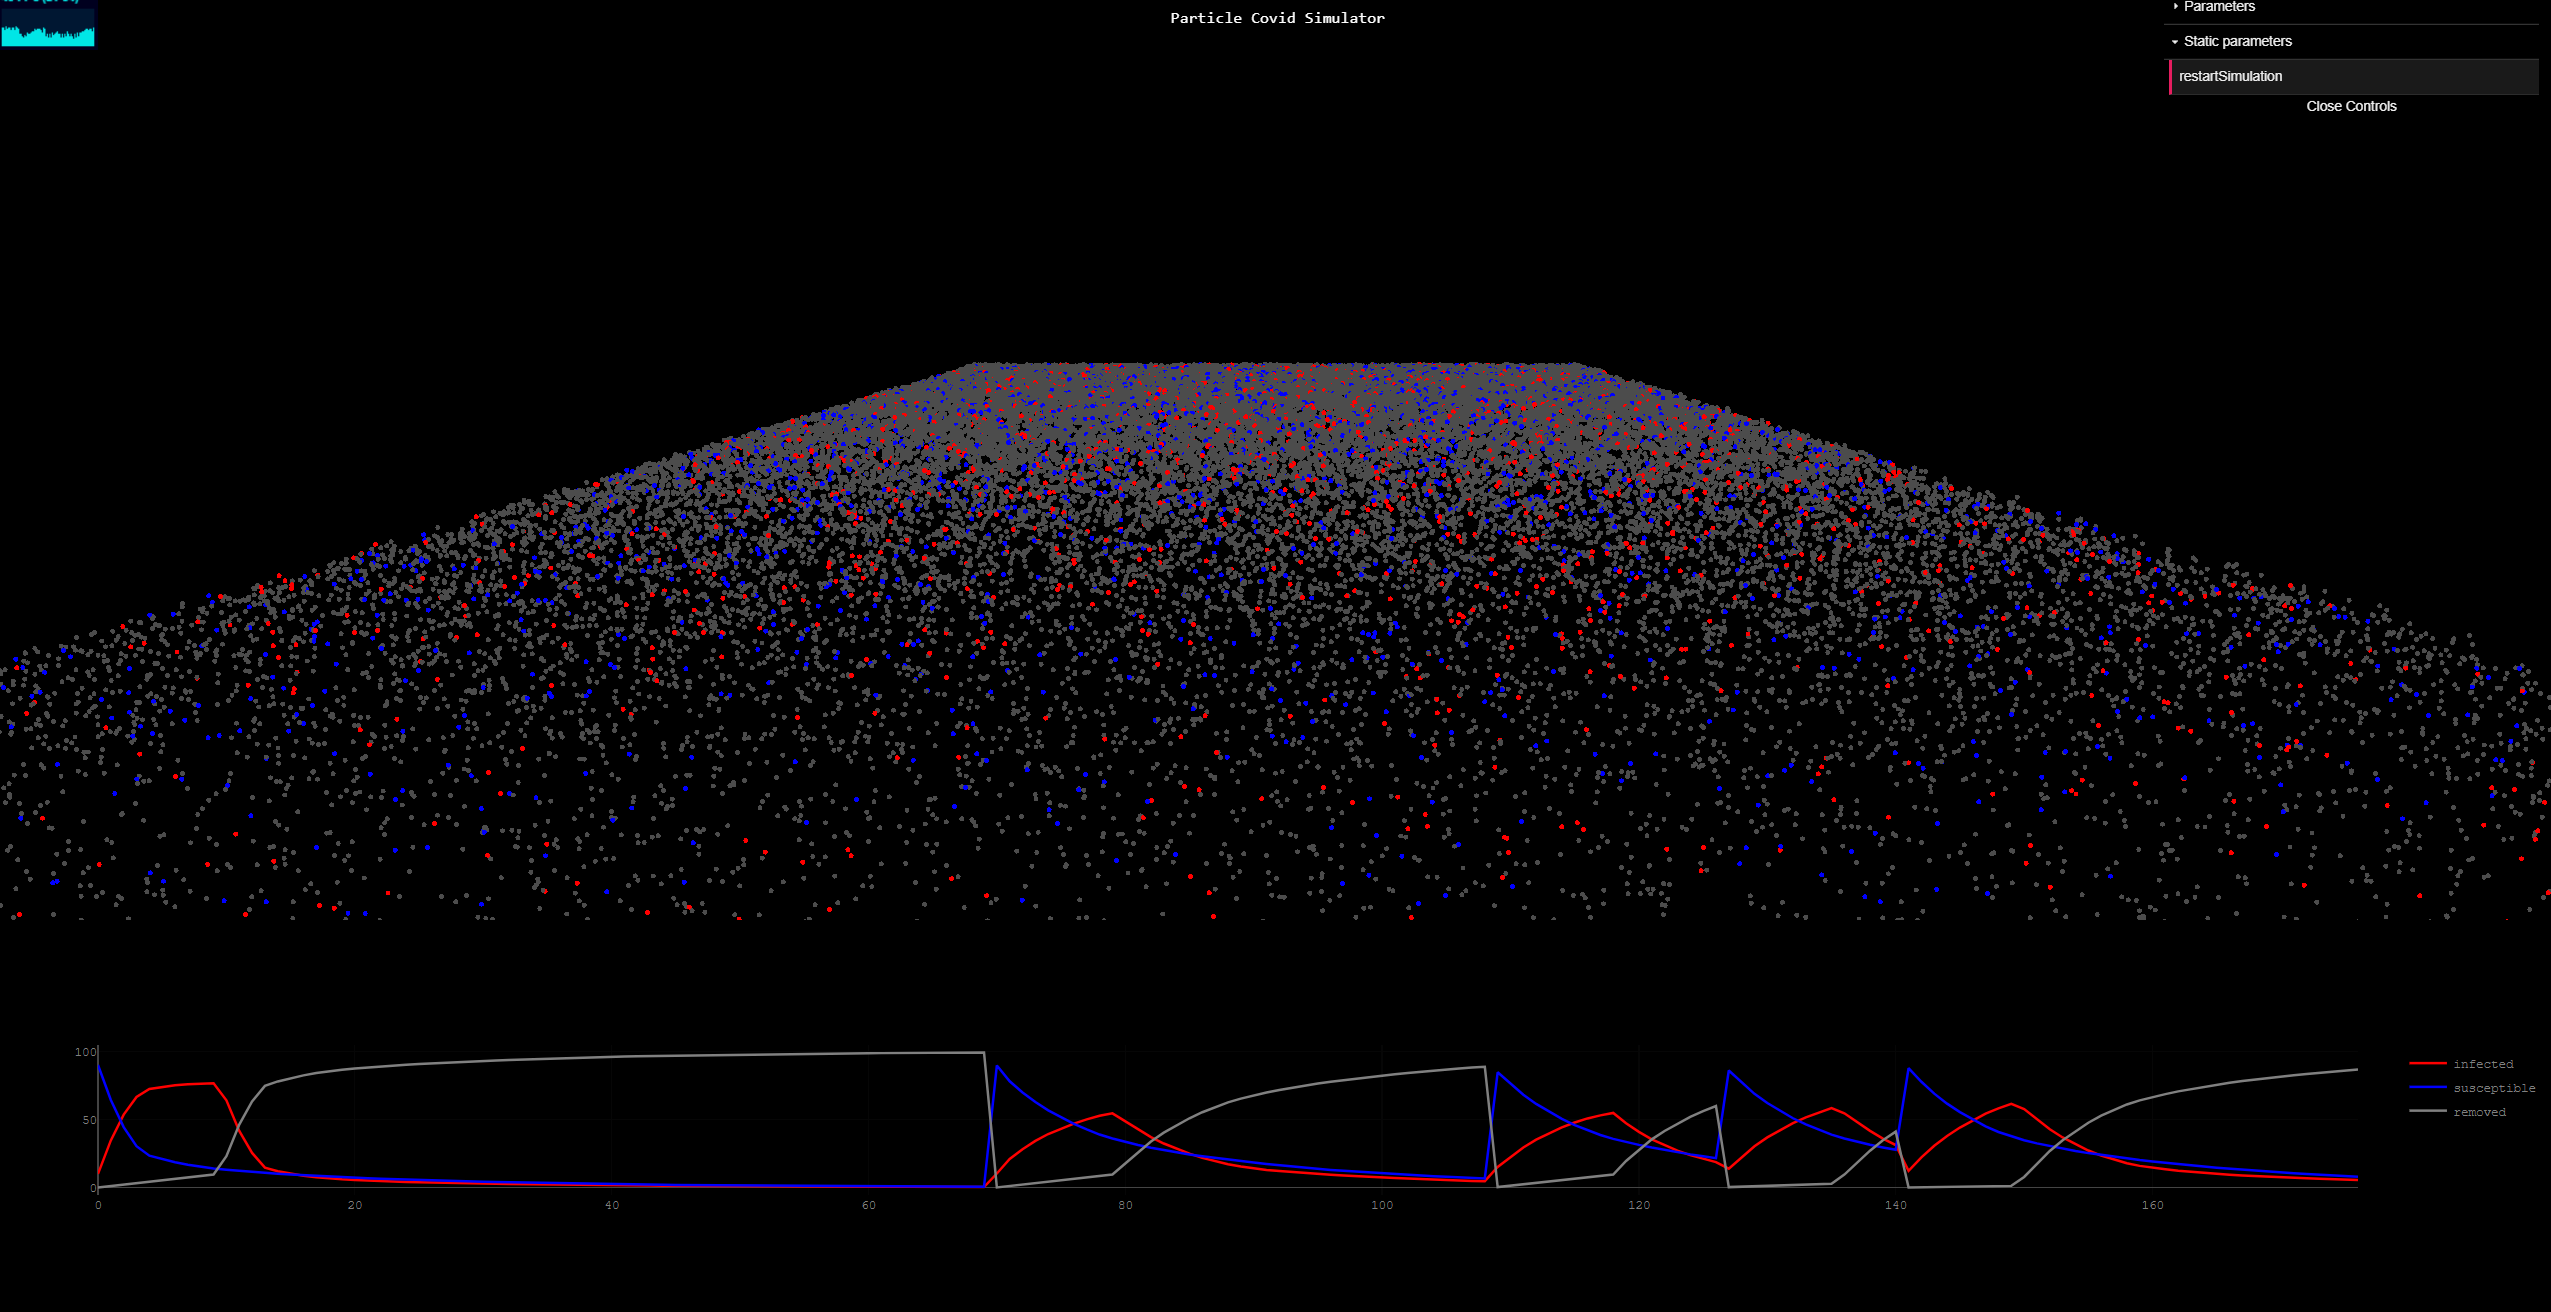
This is an interactive visualization to help people understand how different parameters affect the spread of COVID 19. The simulation has 100,000 particles moving either randomly (or only going to central location), and using the GPU to massively parallelized the computation and visualization of the spread of the disease.
On the top left, one could change some parameters like the percentage of people infected at the start of the pandemic, the infection probability given you are at close distance with an infected person, radius where the disease can be transmitted as well as how much time it takes until the symptoms appear. One can also change policies like being quarantined (only a small percentage of the population can move around).
At the bottom of the screen a SIR (susceptible-infected-removed) model is calculated to see the total infected vs time and see the efficacy of different strategies when dealing with the pandemic.
CBA| Spring 2020 | Individual


